The Invesco Dividend Achievers ETF (NASDAQ:PFM) is one of the funds investing in companies that pay regular dividends. In the case of PFM, stocks must have increased their annual dividend for at least ten consecutive years. This selection criterion gives this fund a bias toward more stable businesses, as evidenced by its overweight allocation to consumer staples and companies like Visa, Mastercard, Apple, and Microsoft.
As a result, PFM invests in companies that, on average, offer above-average yield and dividend growth compared to the broader market, creating a portfolio that has proven less volatile than the S&P 500 index and the peer group of dividend growth ETFs. Thus, while PFM’s overall yields are not as high as other dividend-focused ETFs, it is a fund worth considering for a diversified portfolio in an environment relatively favorable for dividend stocks, especially as interest rates are expected to go down in the coming months.
ETF Description & Highlights
PFM is an exchange-traded fund offering exposure to companies that have increased their annual dividend for ten or more consecutive fiscal years. This fund uses a full replication methodology to track the performance of the NASDAQ US Broad Dividend Achievers Index.
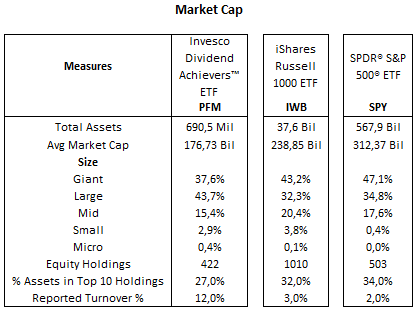
As of August 22, 2024, PFM is composed of 422 constituents, with $690.5 million in AUM and an average market cap of $176.7 billion. It has a composition skewed toward larger capitalization companies, with nearly 81% allocated to large and mega caps, 15.4% in mid caps, and 2.9% in small caps.
PFM’s top ten holdings: Apple (AAPL) (4.4%), Microsoft (MSFT) (3.7%), Broadcom (AVGO) (3.3%), JPMorgan Chase (JPM) (2.8%), Walmart (WMT) (2.7%), UnitedHealth (UNH) (2.4%), Exxon Mobil (XOM) (2.4%), Mastercard (MA) (1.9%), Visa (V) (1.9%), and Procter & Gamble (PG) (1.8%) represent 27% of total assets, with tech stocks as top holdings and a significant presence of financial services (JPMorgan, Mastercard, Visa) and consumer staples (Walmart, Procter & Gamble).
Morningstar, consolidated by the author
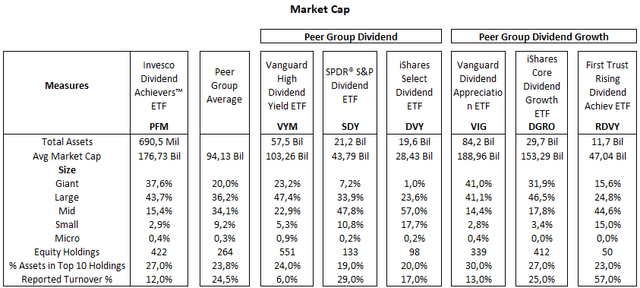
Below is a table with two subsets of dividend ETFs that will serve as a benchmark for PFM in this analysis. The first group is composed of high-dividend ETFs (VYM, SDY, and DVY), where SDY and DVY are weighed by dividends. The second group (VIG, DGRO, and RDVY) focuses on dividend growth over time, where DGRO is a dividend-weighted fund, and RDVY selects stocks based on dividend yield and payout ratio.
Morningstar, consolidated by the author
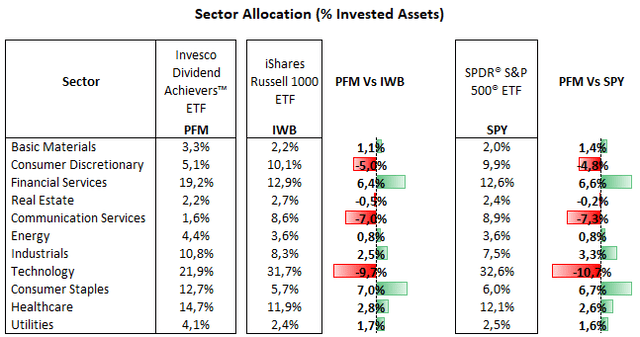
From a sector allocation perspective, PFM’s largest allocation is to the Technology sector, with 21.9% of total equities, followed by Financial Services with 19.2%, Healthcare at 14.7%, Industrials at 10.8%, Consumer Staples at 12.7%, Consumer Discretionary at 5.1%, Energy at 4.4%, Utilities at 4.1%, Basic Materials at 3.3%, Real Estate at 2.2%, and Communication Services at 1.6%. Compared to the Russell 1000 index, represented by the iShares Russell 1000 ETF (IWB), PFM is overweight in Consumer Staples (+7.0%), Financial Services (+6.4%), and Healthcare (+2.8%), but heavily underweight in Technology (-9.7%), Communication Services (-7.0%), and Consumer Discretionary (-5.0%).
PFM’s overweight allocation to financial services is led by holdings in JPMorgan, Bank of America, Visa, Mastercard, and various insurers, while its allocation to the consumer staples reflects its heavier positions in P&G, Walmart, Costco (COST), Coca-Cola (KO), PepsiCo (PEP) and the tobacco industry.
Morningstar, consolidated by the author
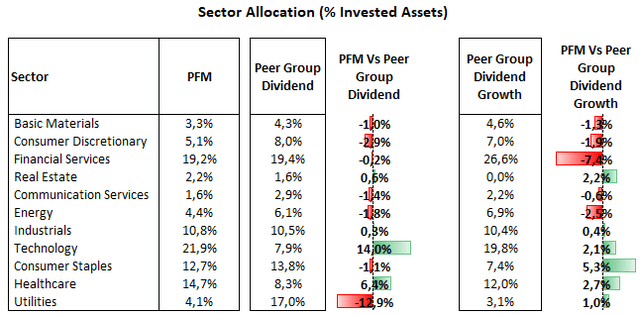
Relative to the peer group of dividend ETFs, PFM is overweight in technology and healthcare, and underweight in utilities, as these ETFs have a strong bias toward higher-yielding sectors like utilities, driven by earnings predictability in the sector and higher payout rates. On the flip side, relative to the peer group of dividend growth ETF, PFM is overweight in consumer staples, but underweight in financial services. This comes as consumer staples is usually a relatively stable and lower growth sector, offering lower dividend growth potential. Therefore, it does not appear as a preferred sector for funds looking for dividend growth over time.
Morningstar, consolidated by the author
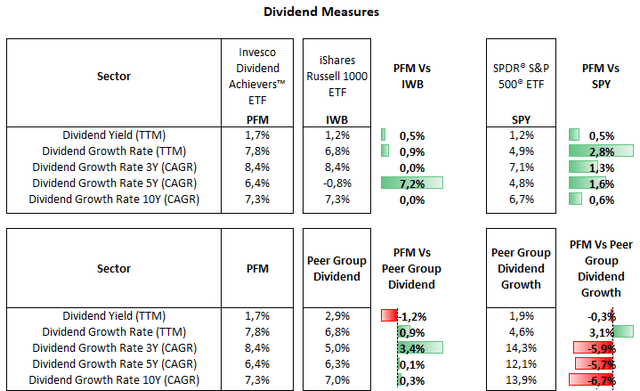
PFM’s allocation bias toward financials and consumer staples results in a relatively higher TTM yield of 1.7% compared to the Russell 1000 and S&P 500 indexes, both at 1.2%. Relative to other ETFs, PFM shows lower dividend yields than the peer group of dividend ETFs, but has experienced higher dividend growth in the past three years, as this peer group is oriented to higher-yielding sectors rather than growth. On the other hand, PFM offers relatively lower yields but also lower growth characteristics compared to the peer group of dividend growth ETFs. This positions PFM as a fund that is not overwhelmingly focused on higher yield or dividend growth. Instead, it has a measured approach, just above the broader stock indexes in these metrics.
Seeking Alpha, consolidated by the author
Valuation Analysis
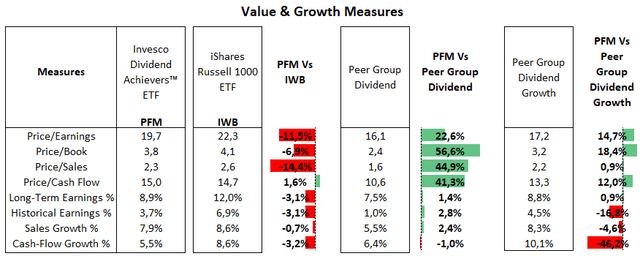
PFM presents mixed figures from a valuation perspective. Its price/earnings ratio of 19.7x is 11% below the Russell 1000 index’s multiple of 22.3x, driven by PFM’s underweight exposure to the technology sector. Meanwhile, PFM’s valuation is higher than both peer groups, as their price/earnings range from 16 to 17x. This is influenced by PFM’s overweight positions in relatively premium valuation names such as Costco (54.5x), Walmart (30.5x), Mastercard (32.8x), Visa (27.0x), and the technology sector, where PFM is especially overweight relative to the peer group of dividend ETFs.
Morningstar, consolidated by the author
Total Returns In Line With Other Dividend Funds, Low Volatility Is A Positive
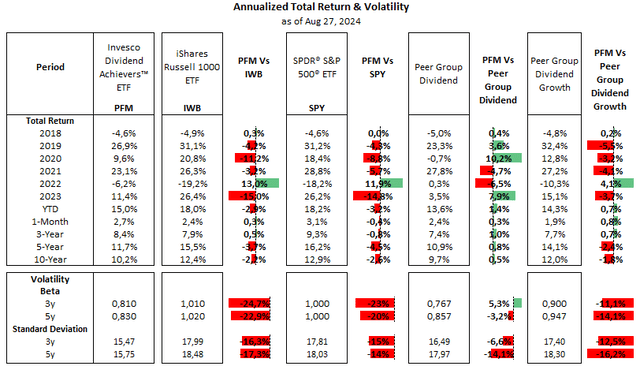
Dividend funds covered in this analysis have largely performed as expected, with relatively weaker returns in years to strong gains partially offset by outperformance during market corrections, as seen in 2022. Meanwhile, these funds have remained less volatile than the broader market, with beta below 1.0, the benchmark of the S&P 500 index’s volatility.
Nonetheless, dividend ETFs have not delivered total returns as strong as the Russell 1000 or the S&P 500 indexes, largely due to lower allocation to technology, while overweight positions in consumer staples and utilities underperformed in the long run.
On a relative basis, the peer group of dividend growth has done marginally better than the peer group of dividend ETFs, as the latter has been dragged down by its underweight position in technology and heavier allocation in utilities. In this context, PFM’s returns have been in the middle of the pack, outperforming by a thin margin in the past three years, but lagging the peer group of dividend growth ETFs in the long run. The flip side of this comparative analysis is PFM’s lower volatility compared to these dividend growth ETFs.
Morningstar, consolidated by the author
In summary, PFM represents a mix of the two peer groups used as references in this analysis, as it is a fund that has delivered above-average dividend growth, though not as much as ETFs focused on dividend growth. While its dividend yield of 1.9% surpasses stock indexes like S&P 500 and Russell 1000, it is lower than those of the dividends ETFs considered here. Meanwhile, PFM’s overweight allocation in defensive sectors, such as consumer staples, healthcare, and selective holdings in stable financial services players like Visa and Mastercard, are reflected in its lower volatility. This is an important characteristic of this fund at this juncture, where uncertainties regarding the magnitude of the economic slowdown may lead to a relatively risk-averse environment and increased volatility in the equity market.
These attributes position PFM as a fund to keep in a diversified portfolio, despite its relatively higher valuation, aiming to achieve above-average yield in an environment where income from dividends in the stock market will become increasingly competitive as interest rates decline following the coming easing cycle that is expected to begin in September.
Read the full article here
