It’s all about semiconductors this week, namely NVIDIA (NVDA). The largest component of the VanEck Semiconductor ETF (NASDAQ:SMH) reports its Q2 2025 earnings report Wednesday after the close. Options traders expect a big move. According to data from Option Research & Technology Services (ORATS), the straddle pricing is high at 9.6%.
That is significantly above the average implied post-earnings swing of 7.7%. Recall in May that shares surged 9.3% following news of a stock split, along the firm topping analysts’ sales and earnings estimates. NVDA has traded higher post-earnings in five of the past six instances, and EPS is expected to have risen about threefold from a year ago.
Clearly, there is optimism heading into the report. But I see balanced risks in SMH right now, and I reiterate a hold rating. Its valuation is lofty, up a turn on its P/E multiple since I last reviewed the fund in March, while seasonality favors the bears right now. With the ETF up 9% since my previous analysis, close to what the S&P 500 has delivered, I assess the chart situation as we approach Q4.
Traders Price In a 10% NVDA Move Post Earnings
ORATS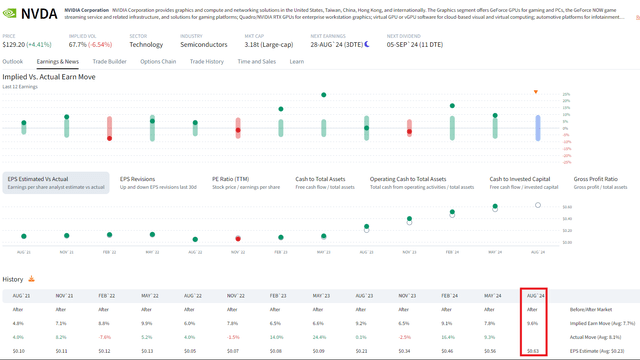
A Busy Corporate Event Calendar Ahead for Semis
Wall Street Horizon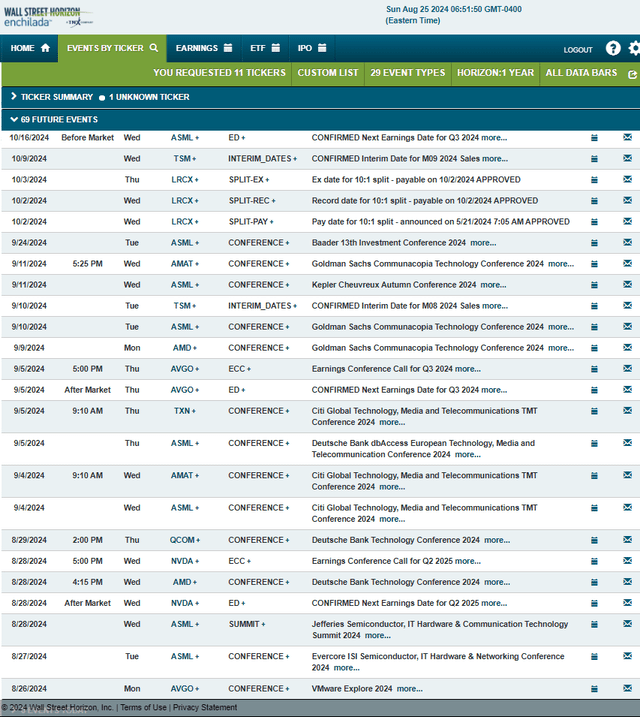
According to the issuer, SMH seeks to replicate as closely as possible, before fees and expenses, the price and yield performance of the MVIS US Listed Semiconductor 25 Index, which is intended to track the overall performance of companies involved in semiconductor production and equipment. The global index aims to track the most liquid companies in the industry based on market capitalization and trading volume.
SMH has grown significantly since my springtime write-up. Assets under management are now $23 billion, up from $18.6 billion five months ago. Still the No. 1 ranked ETF in its Sub Class per Seeking Alpha’s Quant Ranking system, the fund’s 0.35% annual expense ratio is somewhat modest while its 0.42% dividend yield is about a percentage point lower than that of the S&P 500. But share-price momentum is extraordinarily strong, an A+ ETF Grade, and it has been that way throughout 2024 despite bouts of market rotation away from high-growth chip stocks at times.
But SMH can be quite volatile. Its historical standard deviation is 28.7% with even higher annualized volatility per its risk metrics. Still, SMH features very strong liquidity as its average daily volume is almost nine million shares while its median 30-day bid/ask spread is tight at just a single basis point as of August 23, 2024, per VanEck.
Looking closer at the portfolio, the 5-star, Silver-rated ETF by Morningstar is focused in the upper-right corner of the style box, indicating its tilt toward large-cap growth. Just 5% of the fund is mid-cap, and there is no large-cap value access. Thus, SMH is a concentrated bet that the AI theme and demand for semiconductors will persist over the coming cycles.
Investors pay a high price to own SMH. Its current price-to-earnings ratio is above 28, which is an increase from the start of the second quarter. It comes as SMH has rallied while EPS growth estimates for AI-related companies have begun to wane. The fund trades at a very high 9.1 price-to-sales ratio, too. Earnings quality is robust, however.
SMH: Portfolio & Factor Profiles
Morningstar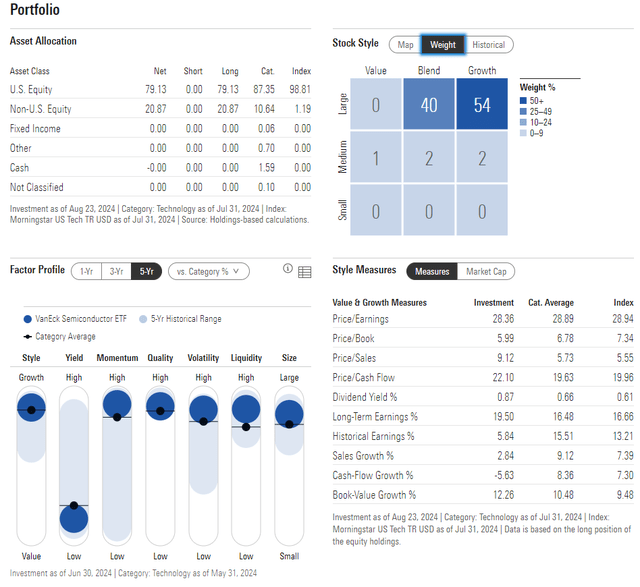
SMH is entirely an Information Technology allocation, and there is high concentration. The top 10 stocks account for nearly three-quarters of the ETF.
So, paying close attention to both the fundamentals and technicals of names such as NVDA, Taiwan Semiconductor (TSM), and Broadcom (AVGO) is important.
SMH: Holdings & Dividend Information
Seeking Alpha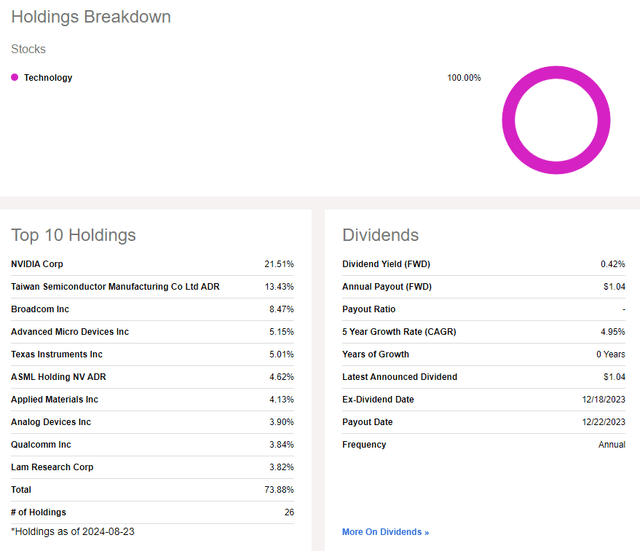
Where we run into some trouble, away from the fundamental valuation, is SMH’s seasonal trends today. April and September are its weakest months, with the latter edging out the former for the most bearish 10-year average performance.
The good news is that October and particularly November have been owned by the bulls in the past decade. Patience with an entry into SMH today is prudent in my view. I will outline key price points to mind next.
SMH: Bearish September Seasonal Trends
Seeking Alpha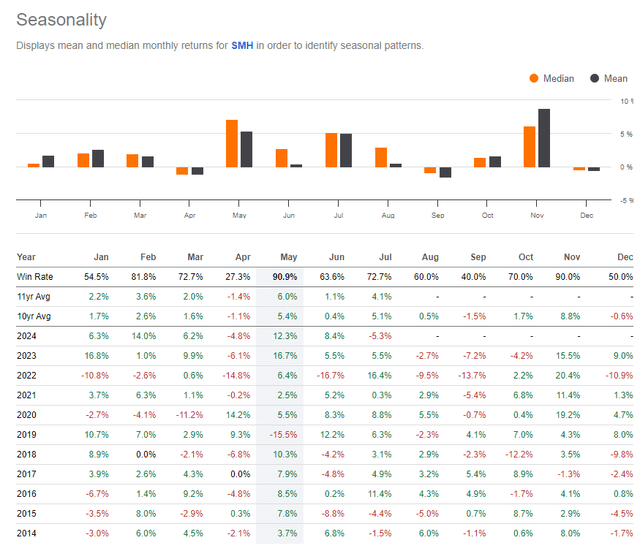
The Technical Take
There have been material technical developments in the last few months with SMH. Notice in the chart below that shares developed key support very close to the $200 mark. The fund dipped to $198 at its April low before ascending to new all-time highs in the summer. A severe and quick drawdown from mid-July through early August culminated in a dip to $200, almost a 30% decline. Despite falling under its long-term 200-day moving average, buyers stepped up for a second time around $200.
The ETF has recovered much of its summertime losses, but its flat 50-day moving average has emerged as resistance. Also take a look at the RSI momentum oscillator at the top of the graph – it printed a bearish negative divergence as price notched a new high. Moreover, with a high amount of bearish volume in the past month and a half, the bears seem to have gained some control of the trend.
Overall, resistance is near $253 and $283 while support is in the $198 to $200 zone.
SMH: Bearish RSI Divergence Followed By a Test of Support Near $200
Stockcharts.com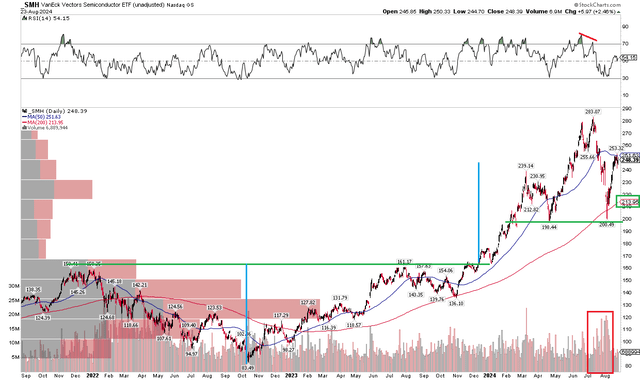
The Bottom Line
I have a hold rating on SMH. I see its valuation is elevated while seasonality and technicals are not all that encouraging despite the fund’s long-term uptrend being intact ahead of NVIDIA’s Q2 report on Wednesday evening.
Read the full article here
